
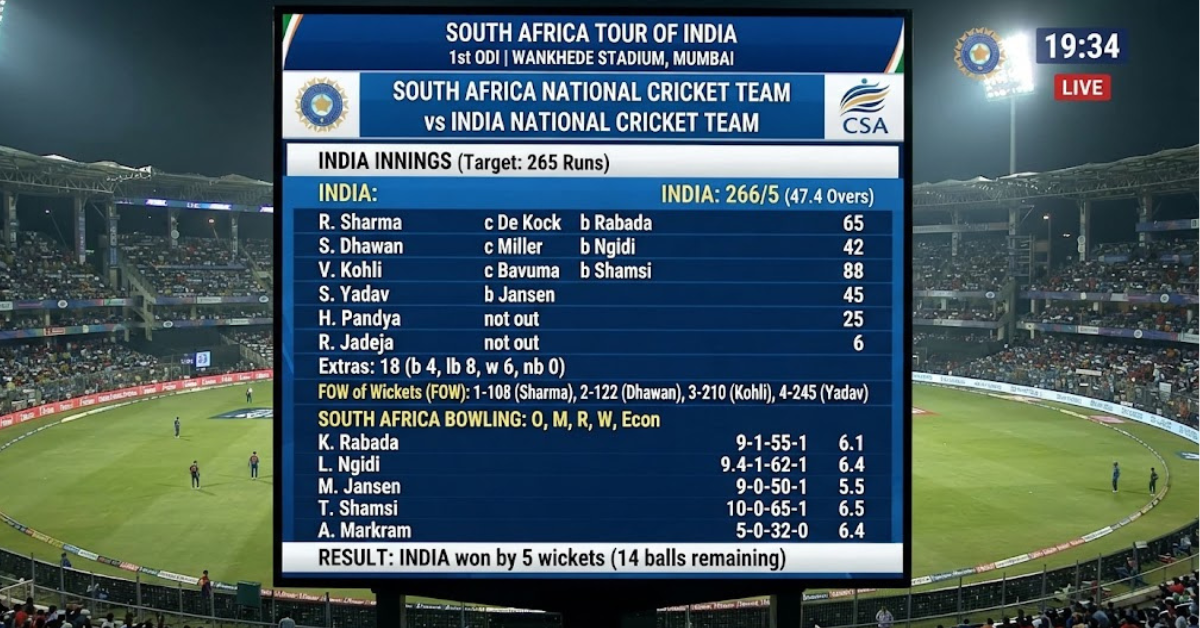
When South Africa national cricket team vs India national cricket team match scorecard is searched, fans are usually looking for more than just the final result. They want to know who scored the runs, which bowlers made the difference, how the match unfolded, and whether the contest was a Test, ODI, or T20I.
India and South Africa have produced plenty of memorable cricket across all three formats. Their most recent completed bilateral series in India featured two Tests, three ODIs, and five T20Is, giving fans a particularly interesting mix of results.
This guide breaks down the India vs South Africa match scorecard and explains how to read the important numbers without getting lost in the statistics.
South Africa vs India Match Scorecard: Latest Results
The 2025–26 South Africa tour of India included matches in Tests, ODIs, and T20Is. The results show just how competitive the two teams were.
| Format | Match | Result |
| Test | 1st Test, Kolkata | South Africa won by 30 runs |
| Test | 2nd Test, Guwahati | South Africa won by 408 runs |
| ODI | 1st ODI, Ranchi | India won by 17 runs |
| ODI | 2nd ODI, Raipur | South Africa won by 4 wickets |
| ODI | 3rd ODI, Visakhapatnam | India won by 9 wickets |
| T20I | 1st T20I, Cuttack | India won by 101 runs |
| T20I | 2nd T20I, Mullanpur | South Africa won by 51 runs |
| T20I | 3rd T20I, Dharamsala | India won by 7 wickets |
| T20I | 4th T20I, Lucknow | Match abandoned |
| T20I | 5th T20I, Ahmedabad | India won by 30 runs |
The results are recorded by both ESPN and NDTV Sports, with the fourth T20I abandoned without a ball being bowled.
India vs South Africa Test Match Scorecard
The two-match Test series was played in November 2025, and South Africa won both matches.
1st Test: Kolkata
South Africa defeated India by 30 runs at Eden Gardens.
India scored 189 in the first innings and 93 in the second. South Africa made 159 and 153, leaving India a target of 124 in the fourth innings.
The match demonstrated how quickly a Test can change direction. After India took a first-innings lead, South Africa’s second-innings total proved just enough to put the hosts under pressure.
2nd Test: Guwahati
The second Test was far more one-sided.
South Africa scored 489 in the first innings and declared at 260/5 in the second. India managed 201 and 140, meaning South Africa won by a huge 408-run margin.
For anyone studying the South Africa national cricket team vs India national cricket team match scorecard, this match is a good example of why totals alone do not tell the whole story. The innings structure, lead, declaration, and fourth-innings target all matter in Test cricket.
India vs South Africa ODI Scorecard
The three-match ODI series was much closer, with India winning two matches and South Africa winning one.
1st ODI: Ranchi
India posted 349/8 from 50 overs. South Africa responded with 332 in 49.2 overs.
India therefore won by 17 runs.
The scorecard shows a high-scoring contest in which both teams pushed the run rate. India’s ability to defend a substantial total ultimately proved decisive.
2nd ODI: Raipur
The second ODI produced an even more dramatic batting contest.
India scored 358/5, but South Africa chased the target successfully, reaching 362/6 in 49.2 overs. South Africa won by four wickets with four balls remaining.
This is one of the clearest examples of why an ODI scorecard should always be read alongside the number of overs and wickets remaining. South Africa did not merely reach India’s total—they did it before the end of the 50-over innings.
3rd ODI: Visakhapatnam
India bounced back strongly in the final ODI.
South Africa were dismissed for 270, while India reached 271/1 in 39.5 overs. India won by nine wickets, finishing the chase with 61 deliveries remaining.
The result gave India the ODI series despite South Africa’s impressive chase in Raipur.
India vs South Africa T20I Scorecard
The five-match T20I series produced another mixture of results.
1st T20I: Cuttack
India made 175/6 before bowling South Africa out for only 74 in 12.3 overs.
India won by 101 runs, one of the biggest margins of the series.
2nd T20I: Mullanpur
South Africa responded in the second match with a commanding performance.
They scored 213/4, while India were dismissed for 162 in 19.1 overs. South Africa won by 51 runs.
3rd T20I: Dharamsala
India regained control in the third match.
South Africa scored 117, and India chased the target by reaching 120/3 in 15.5 overs. India won by seven wickets with 25 balls remaining.
4th T20I: Lucknow
The fourth T20I produced no result because the match was abandoned without a ball being bowled.
This is an important reminder when searching for a complete South Africa vs India match scorecard: an abandoned match may appear in the series record even though there are no batting or bowling figures.
5th T20I: Ahmedabad
India finished the T20I series strongly.
India scored 231/5 in 20 overs, while South Africa managed 201/8 and India won by 30 runs.
What the India vs South Africa Scorecard Tells You
A cricket scorecard contains much more information than the final score.
When looking at an India vs South Africa match scorecard, pay attention to these areas:
Batting figures
Batting statistics normally show:
- Runs scored
- Balls faced
- Fours and sixes
- Strike rate
- How the batter was dismissed
Strike rate is particularly useful in limited-overs cricket because it shows how quickly a batter scored.
Bowling figures
Bowling figures can include:
- Overs
- Maidens
- Runs conceded
- Wickets
- Economy rate
In T20 cricket, economy rate can be especially important because even a bowler who takes few wickets may have a major impact by restricting scoring.
Match situation
The score should always be considered in context.
For example, 362/6 is excellent in an ODI, but its significance becomes clearer when you know South Africa chased 359 against India and won with four balls remaining.
South Africa vs India: Why the Matchups Are So Interesting
India and South Africa offer an intriguing contrast in cricketing styles.
India traditionally has enormous batting depth and a large pool of spin and pace options. South Africa, meanwhile, has long been associated with athletic fielding, high-quality fast bowling, and powerful stroke-makers.
That makes their contests particularly interesting across different conditions.
A match in India can place greater emphasis on spin and batting against slower surfaces, while South African conditions can bring pace and bounce into the equation.
How to Read a Cricket Scorecard Quickly
If you only have a minute to understand a match, use this simple approach:
- Check the result. Find out who won and by how much.
- Look at the totals. Compare the runs scored by both teams.
- Check wickets. A score such as 231/5 tells you the batting side lost five wickets.
- Look at overs. This shows how quickly the total was made.
- Find the leading run-scorers. They often explain why a team reached its total.
- Check the best bowlers. Wickets and economy can reveal where the game turned.
- Read the margin. A win by nine wickets is very different from a narrow four-run victory.
This method works whether you are checking a Test, ODI, or T20I.
India vs South Africa Match Scorecard: Key Takeaways
The 2025–26 series produced several contrasting performances:
- South Africa won both Tests.
- India won the ODI series 2–1.
- India won the T20I series after four completed matches, with the fourth abandoned.
- The second ODI in Raipur was a major run chase, with South Africa reaching 362/6 after India made 358/5.
- India’s 101-run T20I victory in Cuttack was one of the largest wins of the series.
- South Africa’s 408-run Test victory in Guwahati was the most emphatic result.
Together, these results show how different the same two teams can look depending on the format.
Frequently Asked Questions
What is the latest South Africa national cricket team vs India national cricket team match scorecard?
In the most recent completed bilateral series listed in the available results, the fifth T20I in Ahmedabad saw India score 231/5 and South Africa make 201/8, with India winning by 30 runs.
Who won the India vs South Africa Test series?
South Africa won both Tests in the 2025 Freedom Trophy series. They won the first Test by 30 runs and the second by 408 runs.
Who won the India vs South Africa ODI series?
India won the three-match ODI series 2–1. India won in Ranchi and Visakhapatnam, while South Africa won the second ODI in Raipur.
Who won the India vs South Africa T20I series?
India won the T20I series. India won the first, third, and fifth matches, South Africa won the second, and the fourth match in Lucknow was abandoned without a ball being bowled.
What was the highest team score in the India vs South Africa series?
Among the completed matches in the 2025–26 tour, South Africa’s 489 in the second Test at Guwahati was the highest team total.
What was the closest India vs South Africa match in the ODI series?
The first ODI in Ranchi was decided by 17 runs, while the second ODI was won by South Africa by four wickets. The third ODI ended in a nine-wicket victory for India.
Where can I check a full India vs South Africa scorecard?
Full scorecards are available through major cricket-results services, including ESPN and NDTV Sports, which provide match-by-match results across Tests, ODIs, and T20Is.
Conclusion: India vs South Africa Match Scorecard
The South Africa national cricket team vs India national cricket team match scorecard is more than a collection of runs and wickets. It gives you a quick picture of how a match was won, where the momentum shifted, and which performances mattered most.
The 2025–26 tour provided an excellent example. South Africa dominated the Test series, India took the ODI series, and India also finished ahead in the T20Is. The contrasting results underline why format, conditions, batting tempo, bowling efficiency, and match situation all matter when judging these two teams.
If you are checking an India vs South Africa match scorecard, start with the result and team totals, then dig into individual batting and bowling figures. That simple approach turns a long list of statistics into a much clearer picture of what actually happened on the field.